Graphical Representation
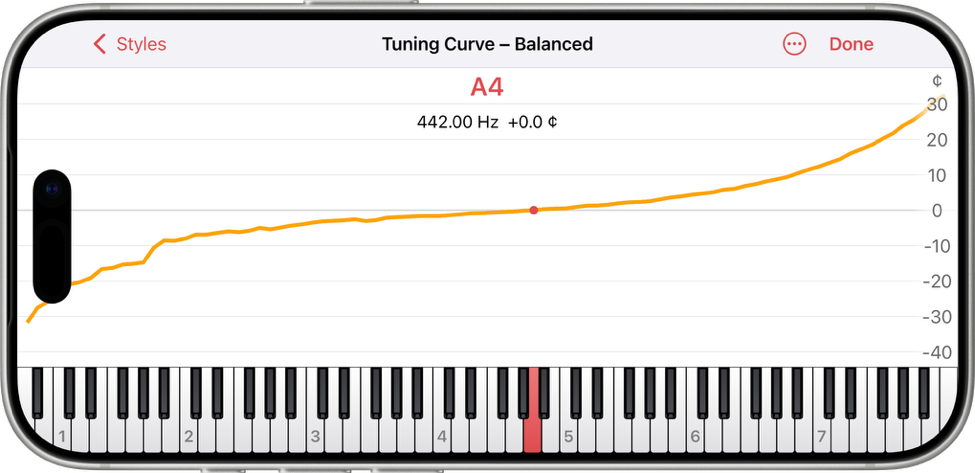
Based on the chosen tuning style and the measured inharmonicity, pianoscope calculates an individual tuning for each instrument. In this view the result of this calculation is displayed graphically as a so-called tuning curve or Railsback curve.

The curve shows for each tone in cents how much the calculated pitch deviates from an equal temperament. Since the concert pitch is fixed, it is always located on the zero line. The tuning curve shows how much pianoscope has to stretch a tuning to compensate for the inharmonicity of an instrument.
Tap a key on the on-screen keyboard to display the exact pitch and deviation values for a tone.
| By pinching horizontally with two fingers you can continuously change the width of the curve. By pinching vertically, you can change the height. |
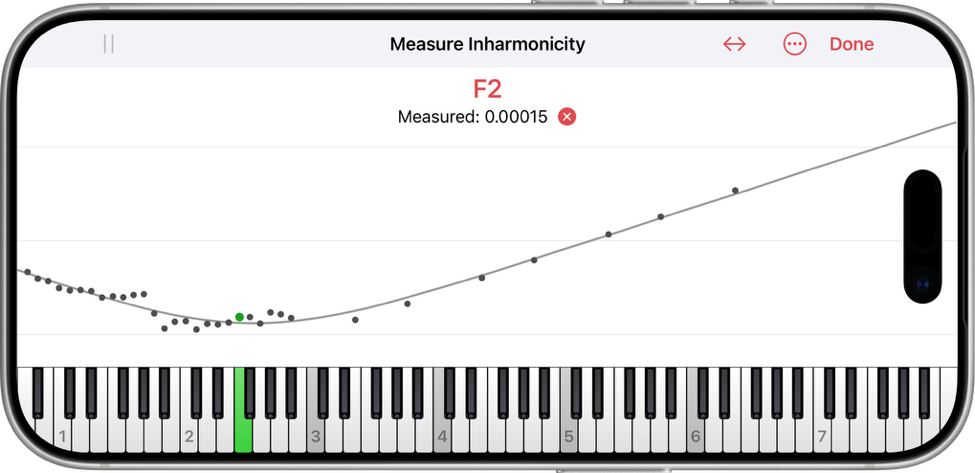
Jumps and irregularities in the inharmonicity curve are also reflected in the tuning curve, as in this example.
| You can use the Curve Settings of the inharmonicity view to smooth the tuning curve if necessary. |